
Grafana for real time JMeter test monitoring
Motivation
The JMeter tests run are run in a periodic basis as part of the scheduled performance tests. The test reports including various metrics and details are generated after the completion of the test run. It would be advantageous to the team if the test status could be monitored in real time so that any evidence of a correlation between the failing components could be established.
Architecture
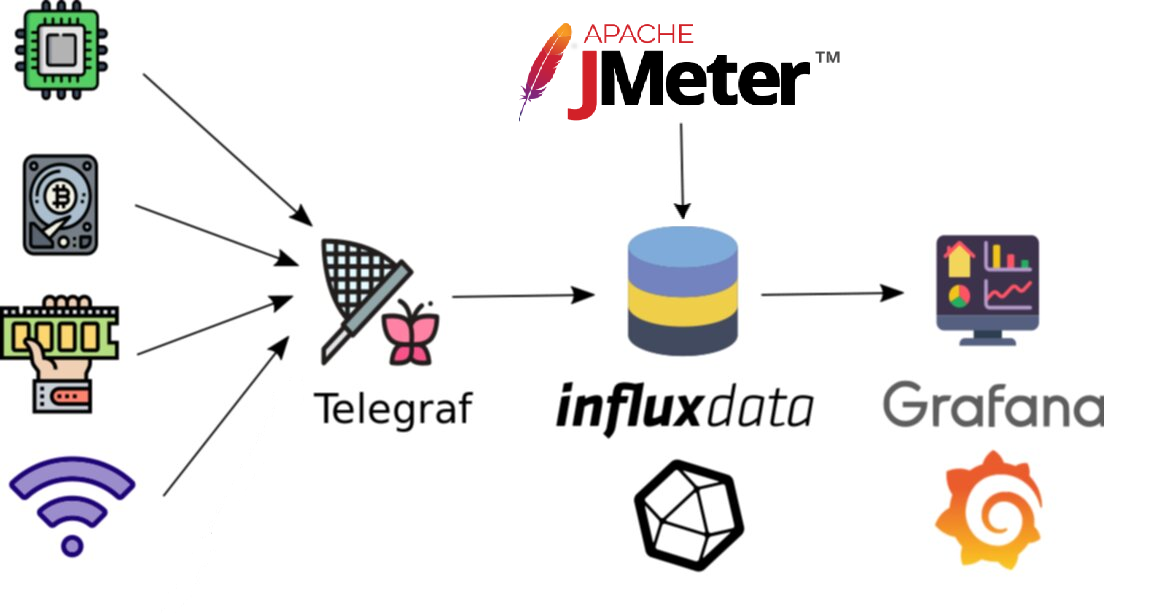
Telegraf : Collects the server metrics via an installed agent and stores it in InfluxDB backend
JMeter : Sends the test stats to InfluxDB using BackendListener listener
InfluxDB : Stores the metrics collected
Grafana : Finally, these metrics are visible via Grafana dashboards
Introduction
Grafana is an open source, real time metrics visualization tool which supports a plethora of data sources including InfluxDB, Elasticsearch, MySQL, MSSQL, etc. The tool can either be ran locally or can be hosted in Grafana Cloud as well. For this documentation, we will be looking at the steps to install the tool locally and add other dependencies along the way. There is a nice collection of visualization options to show the metrics which are highly customizable.
Installation
Grafana
Latest version of Grafana can be installed from here which also provides the option to install it locally or use it in a hosted environment. After the download is complete, the service should up and Grafana should be available at http://localhost:3000.
InfluxDB
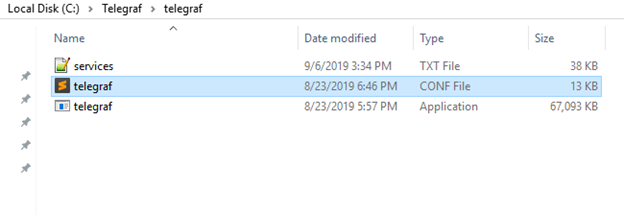
After Grafana is successfully installed, the next step is to install the backend service, which in this case is InfluxDB. InfluxDB is an open source time series database which is optimized for time-stamped series data and can be downloaded from here. After the installation is complete, the folder structure is created as follows:
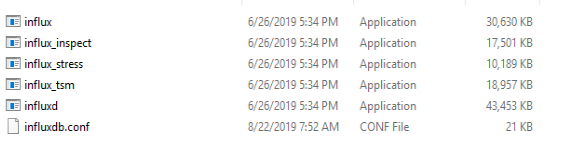
Among these files, ‘influx.exe’ is a CLI used to execute Influx Query Language (InfluxQL) commands and navigate the database. The ‘influxd.exe’ application is used to launch the InfluxDB server. The ‘influxdb.conf’ file is the config file that can be edited to configure the features. It can also be installed and run as a Windows service. The server needs to be up in order to access the database. InfluxDB also provides an http endpoint to allow interaction with the database. In order to enable it, the ‘influxdb.conf’ file needs to be edited with the changes below :
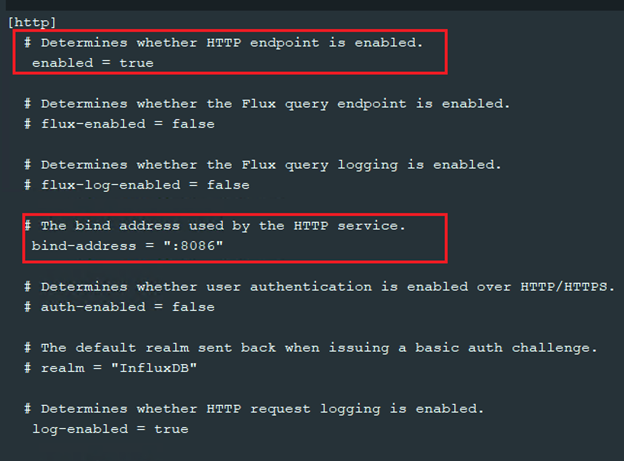
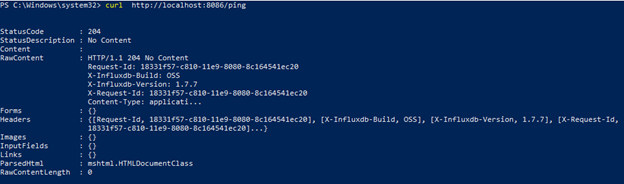
This enables the endpoint service. This can be verified with the PowerShell command ‘curl http://localhost:8086/ping’. The result should be as below :
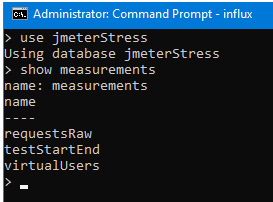
First, a database needs to be created in InfluxDB to hold the sample data from JMeter. To do this, first the influx CLI needs to be opened.
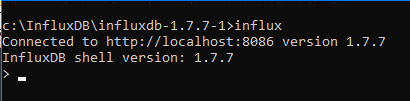
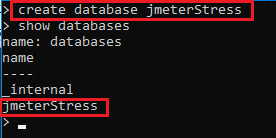
Typing in ‘influx’ will run the InfluxDB CLI. ‘show databases’ can be used to view the existing databases. Currently, there should be just one database with the name ‘_internal’. This database holds information pertaining to InfluxDB itself and is auto-generated during the installation. The command to create a new database is ‘create database <database-name>’.
The database is created as follows, where the database name is set up as jmeterStress.
Configurations
There are a couple of configurations which needs be done on JMeter as well as Grafana in order to generate the measurements and display the live results.
JMX Configuration
Since, the test data needs to be written to the InfluxDB in real-time, a ‘Backend Listener’ needs to be added to the existing test plan. A plugin ‘JMeter-InfluxDB-Writer’ needs to downloaded in order to write the data to InfluxDB so that the Grafana JMeter dashboard can integrate seamlessly without much configuration being needed.
Below are the steps to configure the backend listener in JMeter:
-
Add the Backend Listener to the test plan
-
Configure the Backend Listener as follows:
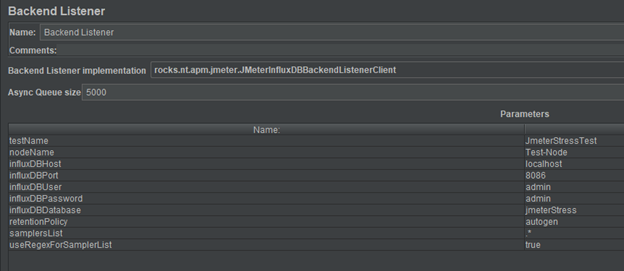
Fig.Configuring the BackendListener options in JMeter ‘testName’ is the name of the test.
‘influxDBHost’ and ‘influxDBPort’ are set as according to the InfluxDB host and port addresses.
‘influxDBUser’ and ‘influxDBPassword’ are the user credentials for the InfluxDB.
‘influxDBDatabase’ is the target DB to store the data.
Linking Grafana and InfluxDB
Now that InfluxDB and Grafana are set up, the connection between the two needs to be established as well. Below are the steps to achieve this :
Add datasource
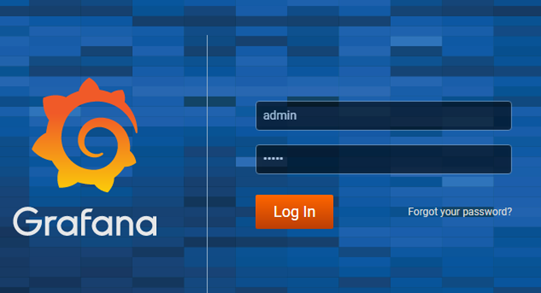
Navigate to http://localhost:3000 or wherever Grafana is being hosted. At the start a login page is displayed where the default username and password values are ‘admin’ and the password can be changed after the login.
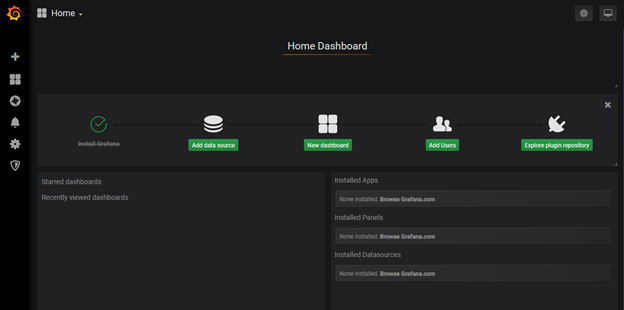
After the login, the user is directed towards the default dashboard. Currently, it holds the options to add a new data source, create a new dashboard, add users, etc.
Click on ‘Add data source’ to configuration database connection.
Then a time series database can be selected from the list of options presented. After selecting ‘InfluxDB’ there, a configuration page opens where the specific details can be configured.
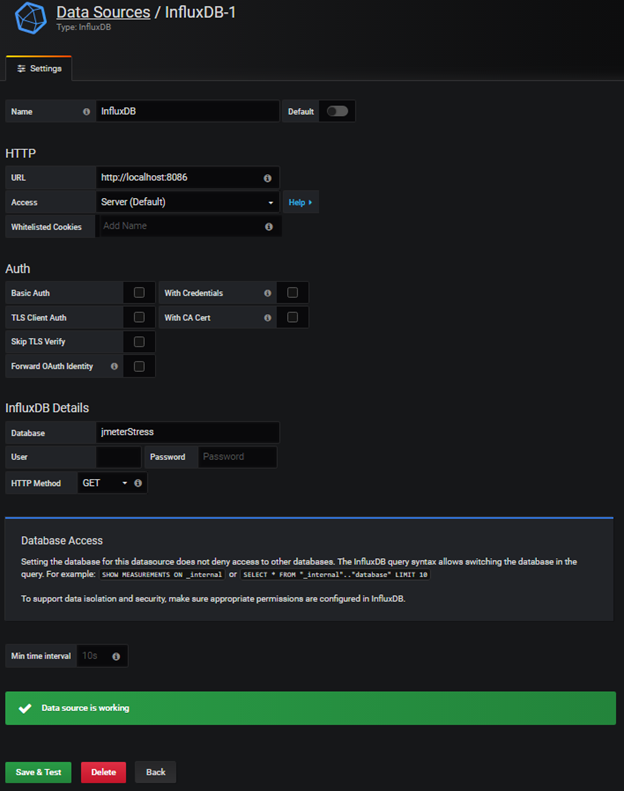
After configuring the database details and clicking ‘Save & Test’ button, a message saying ‘Data Source is working’ should be displayed.
Create a Dashboard
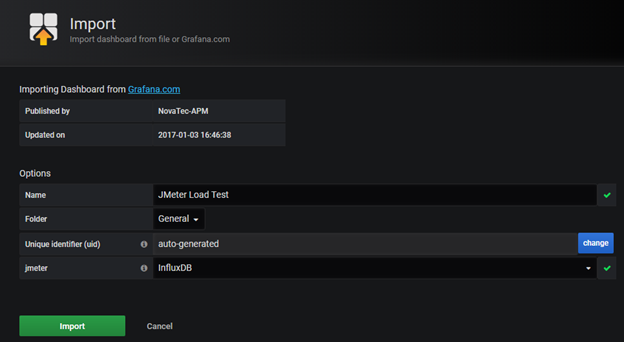
The next step after configuring the data source is to create a dashboard. There are plenty of options to choose here as well since Grafana provides a great variety of dashboard template to choose from.
This option can be selected by clicking on the ‘+’ icon at the top-left corner of the menu and selecting ‘Import’ under the create sub-menu. For our implementation we have used this dashboard which has all the basic visualization options. The dashboard can be imported by either supplying it’s dashboard ID or it’s JSON file.
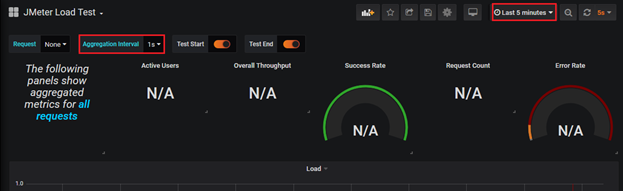
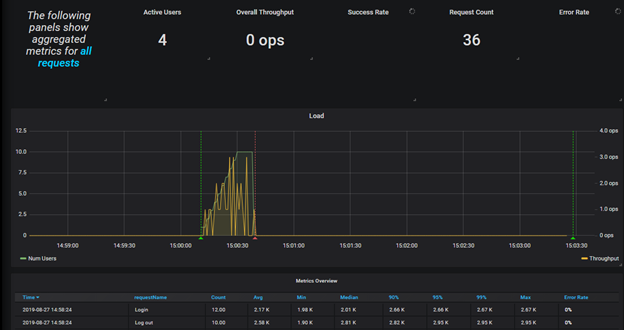
After the import is completed, a dashboard with empty visualizations is generated. By default, the time period filter for which the report is to be shown will be ‘Yesterday’ with a ‘Aggregation Interval’ of 1 minute. The ‘Aggregation Interval’ is the interval at which the data is fetched from the backend. Here, we change it to 1s to collect the data every second. Also, we change the time filter from ‘Yesterday’ to ‘Last 5 minutes’ to show the latest results.
Running the JMeter Tests
To verify whether the set up is successful, the JMeter test plan can be run. As soon as the test are running, the commands below can be used to verify if the data are getting stored in InfluxDB.
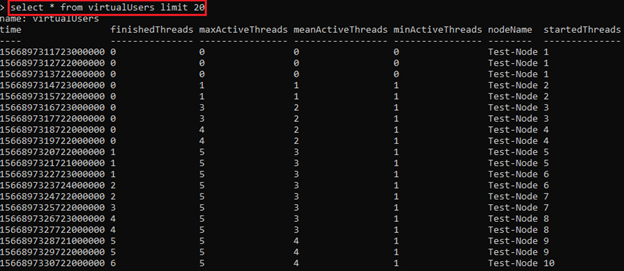
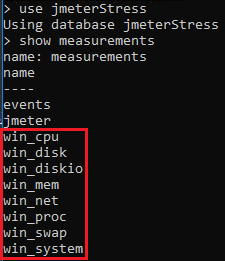
Also, the database is collecting the metrics live from JMeter which can be verified as below :
In InfluxDB, ‘measurements’ can be thought of as tables. Each of these measurements has a timestamped value can be queried like below :
Telegraf
Telegraf is an open source plugin-driven agent used to collect server metrics. The types of metrics to be collected can be customized by adding new plugins or editing existing ones. The goal of using this server agent is to collect the server metrics from the server where the application is being hosted and have them delivered to the backend which in our case is InfluxDB which can then be viewed live from Grafana as earlier.
Installing Telegraf as a Windows Service
-
Download Telegraf from the url below which will download the packaged in a zipped format.
-
Extract the contents on a destination folder. The folder should contain a ‘telegraf.conf’ file containing the Telegraf configurations.
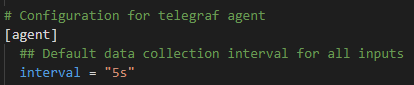
Inside the config file, there are multiple options to collect the server metrics as well as other configuration options. For example, under the ‘[agent]’, there are options which can be configured to select how the metrics will be collected.
For example, the ‘interval’ config option is used to set the duration of the metric being collected.
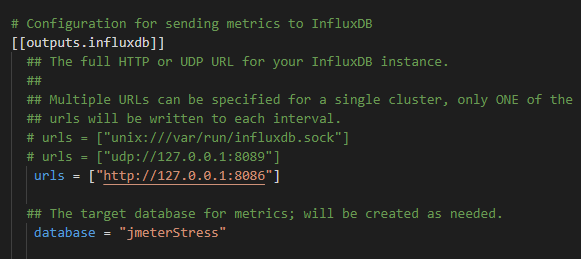
We can leave these options as it is for now. The main focus is on the ‘outputs’ section of this config file. It is here where the output format and destinations are specified.
For example, if the InfluxDB is being hosted locally on port 8086 and the metrics are to be collected in a database named ‘jmeterStress’, then the following configurations should be specified under the [[outputs.influxdb]] section, which is an output plugin of Telegraf.
Now that the backend details are set up, we need to specify which metrics are to be collected. This can be set up under the ‘[[inputs.win_perf_counters]]’ plugin configuration. Some of the common metric options are CPU usage, Process metrics, Disk time and queues, Network metrics etc.
Details of other options are in the url below :
https://github.com/influxdata/telegraf/tree/master/plugins/inputs/win_perf_counters
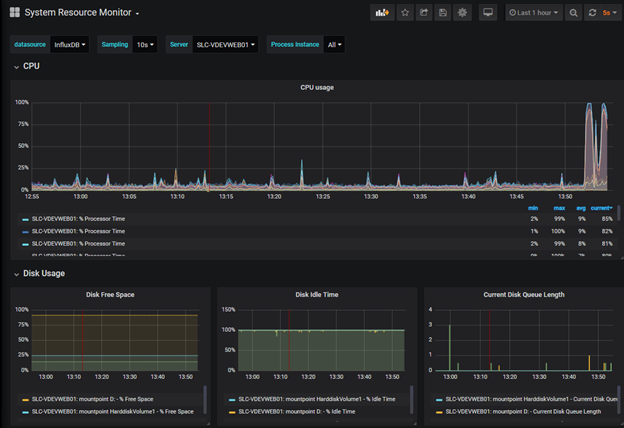
Once these configurations are done the telegraf agent starts sending out the metrics to the backend at the specified interval which can then be shown over Grafana in a live manner.
These metrics can then be represented in Grafana by using any one of the available templates in the url below :
https://grafana.com/grafana/dashboards?dataSource=influxdb&search=telegraf


Leave a Comment